Cities: Skylines

Cities: Skylines

36 ratings
Making Maps With Height Maps
By VecchioChristo
This guide is meant to help users who want more out of their maps, more in terms of detailed terrain, and more in terms of accuracy.
Covers how to obtain 3 and 10 meter DEM's (height maps) as well as GeoPDF from USGS.
For 3 meter DEM's shows how to process and export a DEM raster mosaic from GIS (geographic information system) software.

I will show you how to adjust elevations, establish slope (if required for proper water flow) and embed rivers and streams in your height map with Photoshop.
   
Award
Favorite
Favorited
Unfavorite
Introduction
The following is a detailed guide on how to acquire and use high resolution DEM's ( height maps )

I will show how to prepare them in Photoshop for improved elevation accuracy and detail.

Below are examples of a map produced following these methods as well as a video describing these methods...The video is from my YouTube Channel VecchioChristo
https://www.youtube.com/channel/UCtsrE5g-7lh2owI6pZd56yQ


Using USGS TNM Download
This site contains a multitude of assets for creating maps... is completely free but does require registration before you can download files.
The GeoPDF's (requires Acrobat Reader) are excellent maps that can be stitched together to form your overlay maps (usually requires around 4) while retaining excellent detail. These PDF's are composed of layers that can be isolated and saved as images...streets,contour lines, hydrology etc.

DEM's (digital elevation model) come in several sizes
1 ArcSecond (30 meters) (98 feet)
1/3 ArcSecond (10 meters) (32 feet)
1/9 ArcSecond (3 meters) ( 9.8 feet)

1/9 ArcSecond DEM's provide obviously the greatest detail...that's what were after,
but our quest for detail requires some additional work.
The 1 and 1/3 ArcSecond Dem's download as TIFF files. The 1/9 AS downloads as a folder containing several files. The file were after is a "disc Image" file that is best processed through a GIS (geographic information system) program. They have to be opened and merged...edges don't match
without processing and opening a disc image file is not all that straight forward.
This guide details using ESRI ArcGis Pro which cost $100 per year for individuals...
Qgis is a completely free program that looks and functions in a very similar manner

The following are 5 cards that demonstrate downloading the DEM files.
CLICK ON IMAGE TO ENLARGE

https://apps.nationalmap.gov/downloader/#/productGroupSearch


The Map Depicted above was produced with DEM's from
SwissTopo (link below) The Swiss DEM's have a very small footprint, that map required almost 600 individual DEM's to produce, so it didn't make a very good candidate for demonstration purposes...just too complex!
To demonstrate how this process works I have chosen the area around Newport Oregon requiring just 4 DEM's to produce
https://shop.swisstopo.admin.ch/en/products/free_geodata


NEWPORT OREGON


After you have drawn a perimeter and made your selection of items, click "Search Products", on the Products Tab you will find items that pertain to your selection and can be directly downloaded from there. More items often make the list than you really need. They will also have what appear to be duplicates ( they were produced in different years) You can use "footprint" and "thumbnail" to help determine if its a selection you need.
The Above cards relate to GeoPDF's...Below are the DEM's


Processing Files with ArcGis Pro...Qgis is a free alternative
The following are 5 cards that demonstrate this process...


GIS software can seem rather unfamiliar to those of us not practiced at using them, but we only need them for 2 things, OPEN THE DEM's and OUTPUT a height map we can use. With the help of the guide below and tons of video tutorials and guides online, it's all very doable !


SCREENSHOTS OF ARCGIS PRO


For our purposes you can export either 16bit unsigned png or 32bit tiff...
The 32bit tiff will have to be converted to 16bit before you can use it, photoshop will view it as an HDR image. Signed and unsigned just refers to whether the file depicts above water or below (positive or negative numbers)...we want positive (unsigned)


I put the above card in because of my own experience...the first couple of times I used the Mosaic to New Raster tool I wasn't expecting it to export an image, but it does. So if you find yourself in this predicament and don't know where you sent the file, I thought I should show how to directly export the merged DEM's


Editing in Photoshop
This card below is important to understand

We will be adjusting height map elevations to match the actual terrain
Precise greyscale values are required to get good results
Don't allow your 16bit greyscale height map to be converted to any other format...
it will destroy it's fidelity and become unusable for our purposes.

The way this works is as follows... say your sea level is 48m and your base or lowest ground is 50m
you take off an elevation for a point in Google earth thats ...say 100m...
To calculate the value for that elevation take your base ground level of (50 + 100 ) x 32
So your greyscale "K" 16 bit value for that elevation is 4800
You can not enter 16bit values numerically in Photoshop, but you can read them,
You place a color sampler widget or tool on the spot you want to adjust, then adjust image lighten or darken and watch the numeric readout for that point until you match, its very tedious to match exactly and not really needed but get close.. within 10 points should be good enough.


I show this image just so you know what to expect and don't think the image is flawed.
This is a 16bit unsigned image. (unsigned means no negative values like under water)
32 bit floating point tiffs will come in almost completely white.
You just have to adjust the exposure to reveal the image, (Note..if you adjust it with exposure on a separate layer, you will have to merge or collapse them before the image looks right.


This next card is a little confusing, I was trying to cram too much into one card.
In photoshop use threshold to find the whitest point on your map, narrow it down to a small area
Then go to Google Earth and find the elevation for that point and a few others, write them all down making a note of where they came from...this is for future use. You will see in a minute.


In the previous card we set our black point and white point using levels
In this card we create a curves adjustment layer and using the elevation values you collected from Google Earth a minute ago...calculate the required greyscale value for those points and make your adjustments.. This will take a little finesse to get it right because each adjustment will throw the one you just did off a little, just work back and forth a couple times and you will get it pretty close.


This works because all of the terrain is lighter than the underlying layer,
after doing this you once again will have to tweak your elevation values to
bring them back in line.


https://www.youtube.com/watch?v=EJunP8fp6zI&t=320s

Adding Rivers and Streams to our map
So you don't have to do it in the Map Editor

The card below that says fill rivers with black and set blending to subtract
is incorrect.
You must fill with a low grey value that's darker than whats
underneath, you cannot subtract 100% black. Fill water areas with a dark grey value and use subtract and this procedure works.


This is what we have produced using this procedure
I created a Theme with all medium Grey color so that the terrain can be clearly seen


15 Comments
Jonut 27 Nov, 2022 @ 4:54pm 
I'm having a problem similar to Ricebug - tried SEVERAL different sites and data sets of varying qualities, but the issue is always the same:

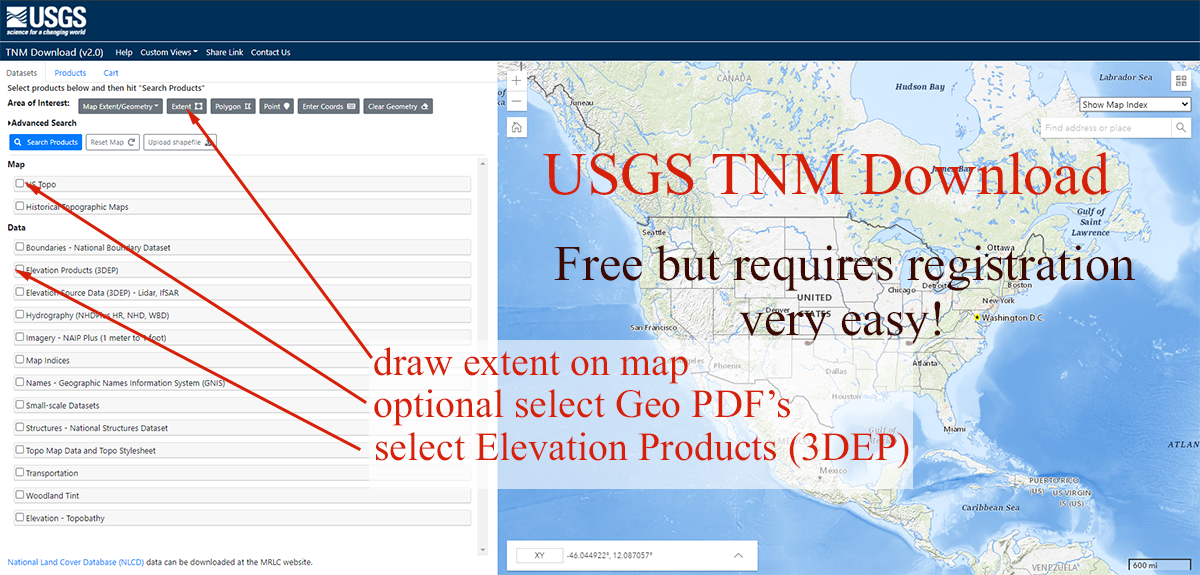
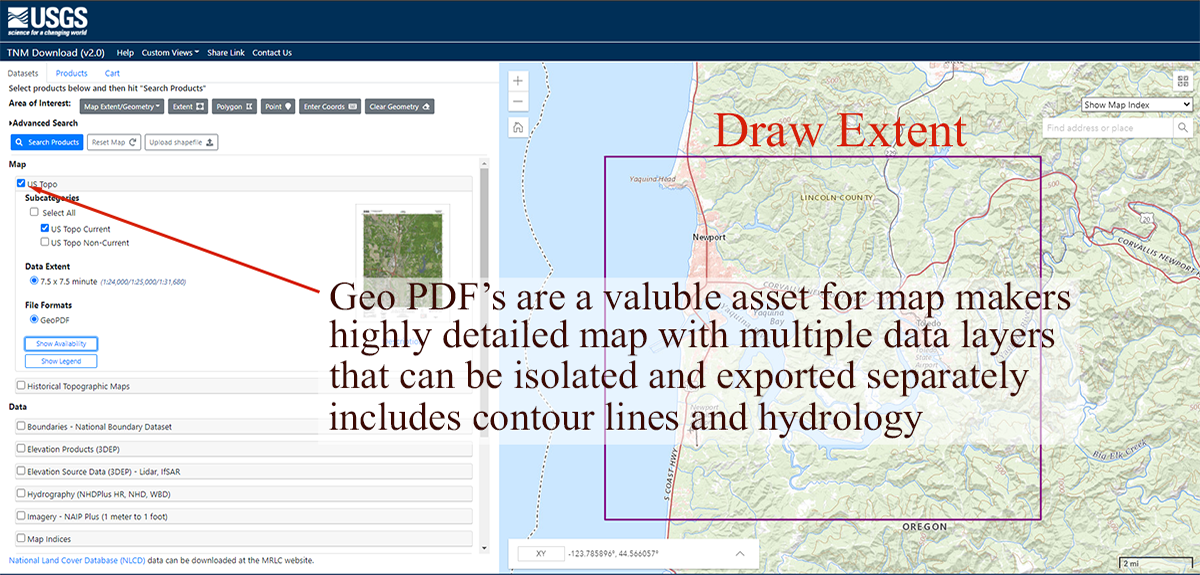
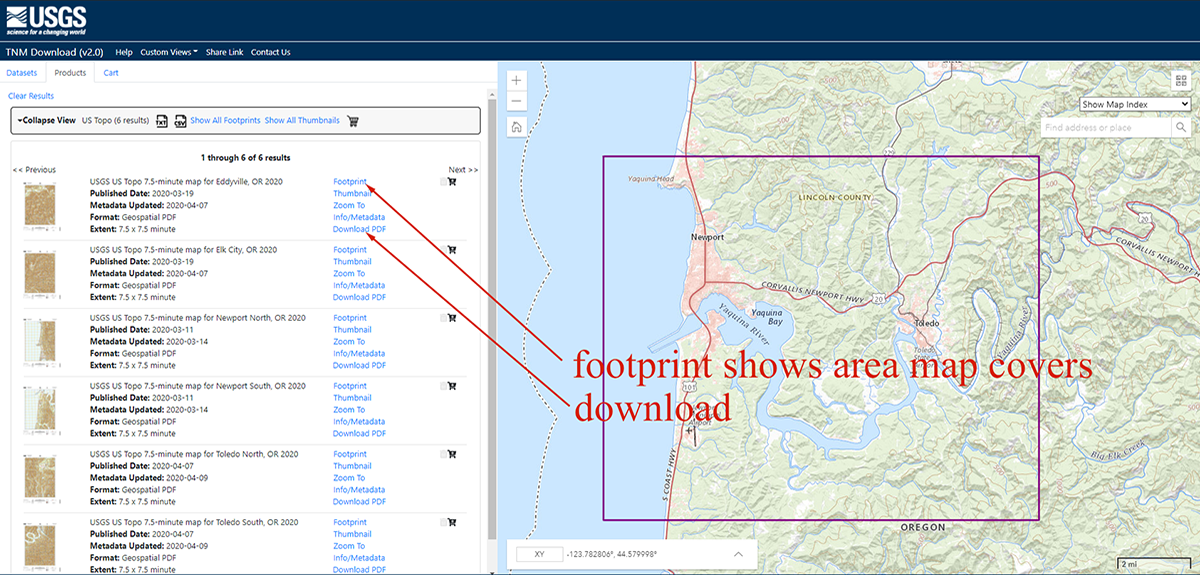
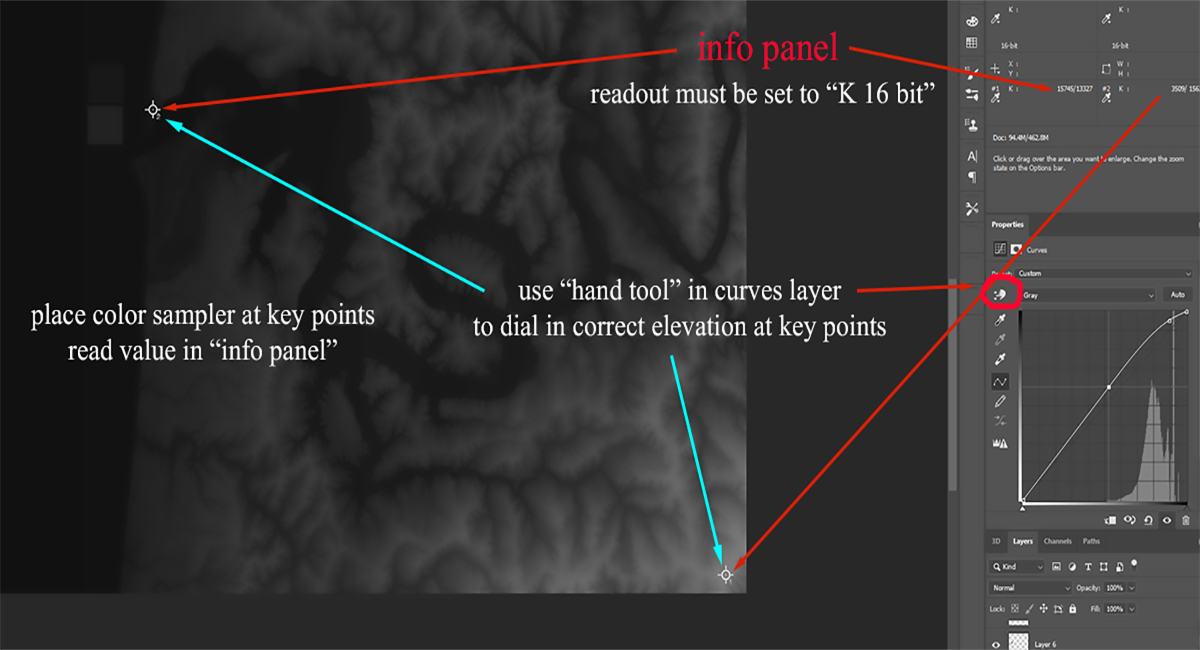
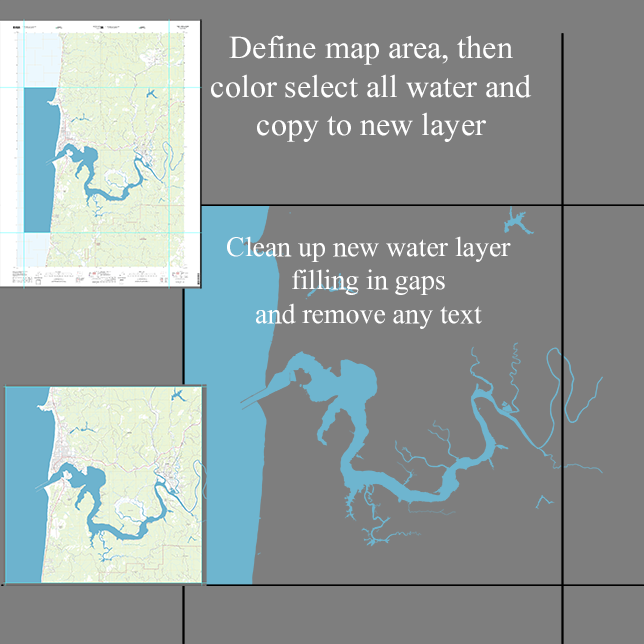
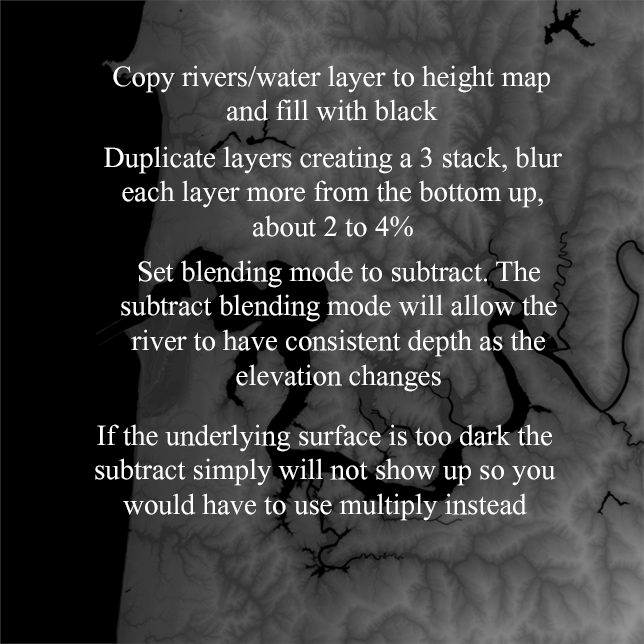
1. I select the desired extent
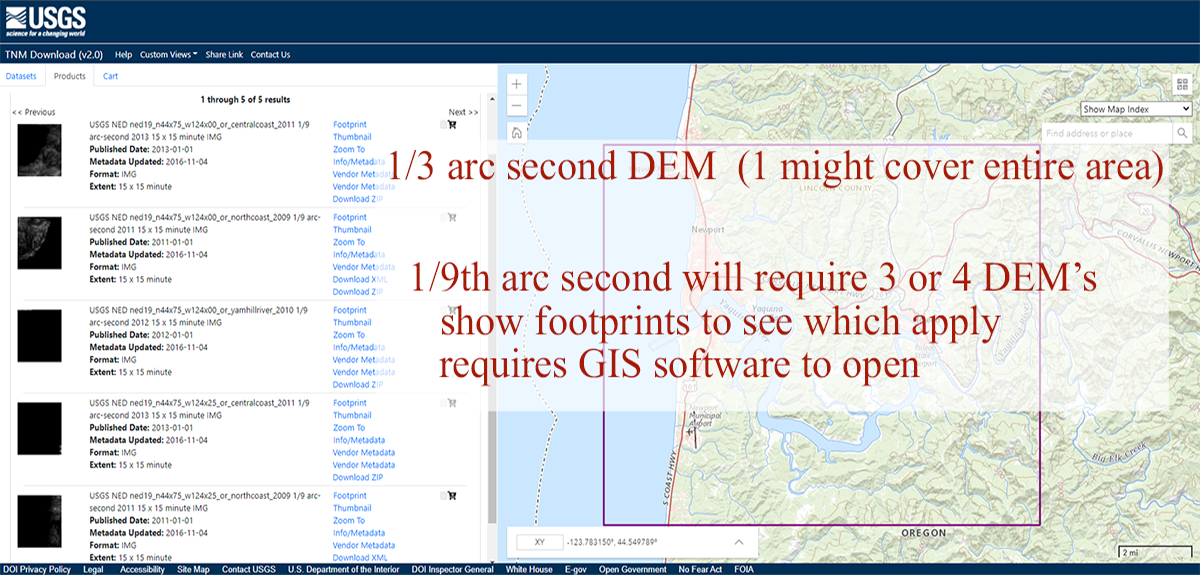
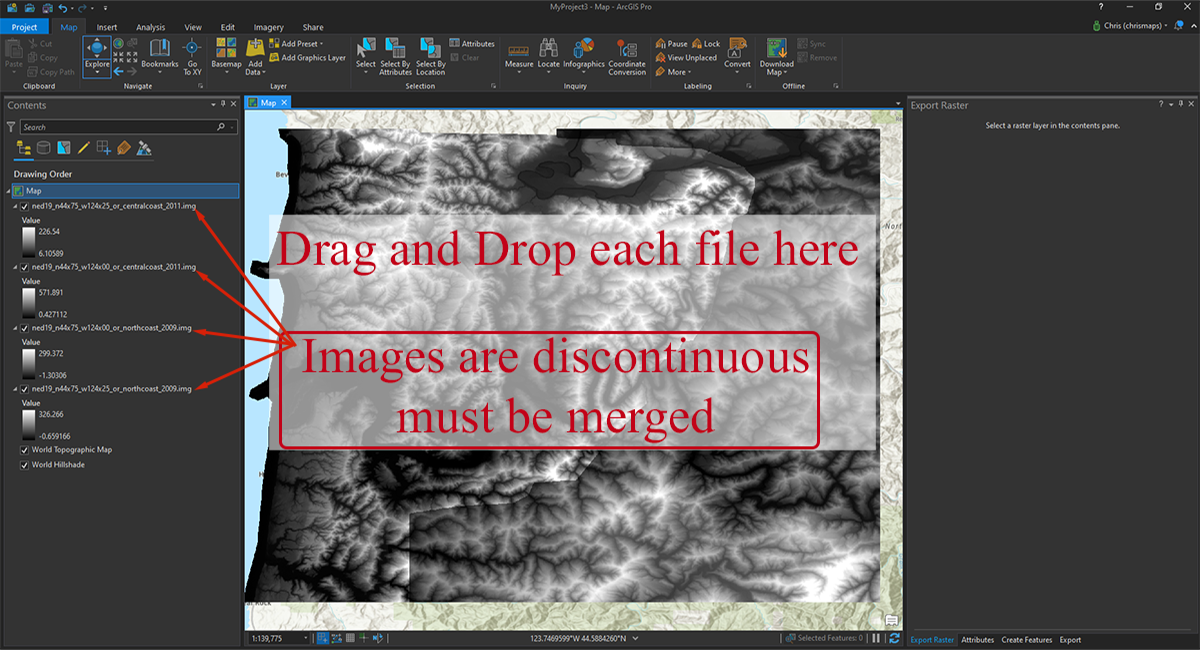
2. The available downloads are HUGE areas/files that simply *include* the extent I selected - no apparent way to modify
3. The downloaded image must be CROPPED to cover only the extent I desire
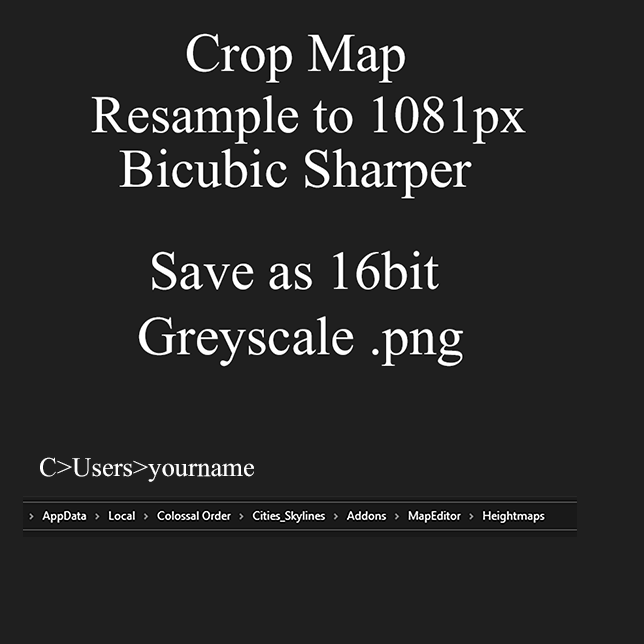
4. Cropped image must then be RESIZED (to 1080 x 1080 px) to import into C:S map editor, which causes a major quality drop and thus defeats the purpose.

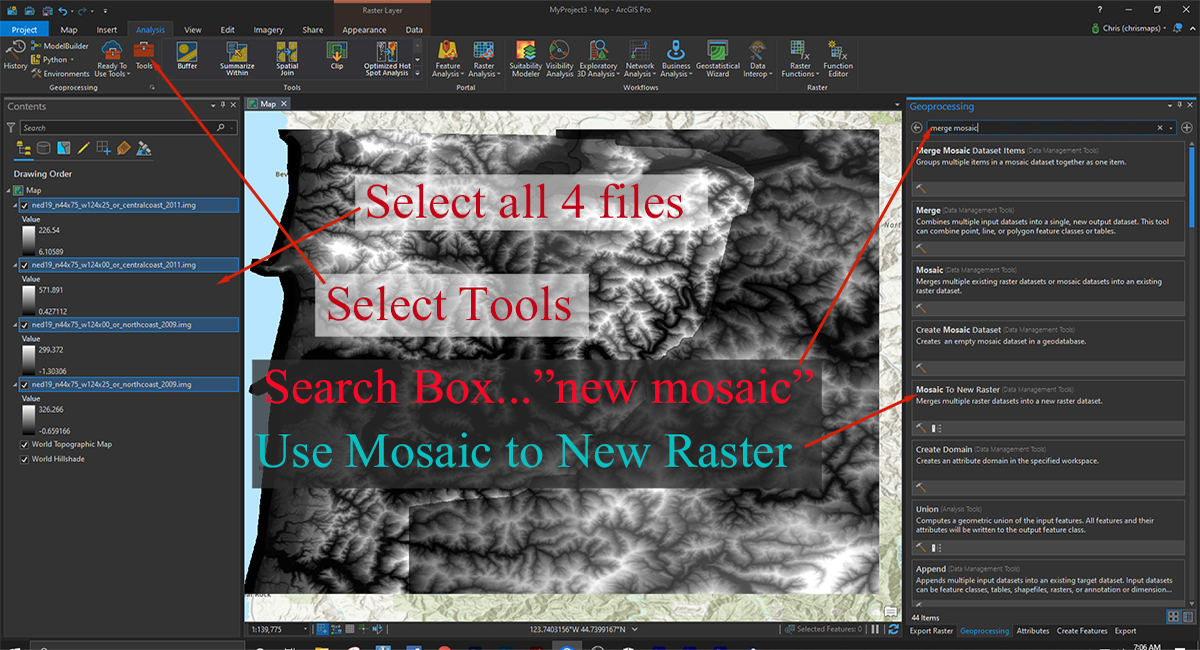
I looked around on these sites quite a bit and haven't yet found a way to download *only* what I define and no more. Even tried creating a shapefile - no luck there. Seems the mosaic method (like your video) may be better, if you can find a place to download the smaller files (which I haven't). Will keep trying eventually, but for now, frustrated and moving on!
Yuslo 2 Jun, 2022 @ 4:39am 
How do I get geodata from places in Europe or rather Germany?
VecchioChristo  [author] 14 Oct, 2021 @ 11:40pm 
DEM's are meant to be processed through GIS software like QGIS or ARCGIS, but the lower resolution DEM's can be brought right into photoshop, the GEOTIFF's contain more info such as global position than reg images. I'm not an expert in these areas, just read and learned enough tp be able to get the maps!
Ricebug 14 Oct, 2021 @ 7:59pm 
Thanks, brother. BTW, I tried taking over terrain.party. The host won't or can't find the creator. COVID probably got him.
VecchioChristo  [author] 14 Oct, 2021 @ 6:09pm 
Read the second note I just posted, as I explained the rectangle does not "cut" the DEMS it merely provides all data contained within the selection box. You have to bring the DEMS into photoshop and cut them down to size there.
Ricebug 14 Oct, 2021 @ 6:04pm 
I've played your video a dozen times. I've looked at a host of YT videos, the most worthless being the USGS ones. When you discover how to render ONLY what's inside the purple box, get back to me.

Love your work, BTW. Top Drawer stuff.
VecchioChristo  [author] 14 Oct, 2021 @ 6:03pm 
Ricebug, at first I didnt understand the question, the USGS site produces whole DEM scans, each DEM is a discrete scan or projection. The selection process with the rectangle does not "cut" the DEM, it just includes all DEMS that have data that fall within the confines of the selected area.
VecchioChristo  [author] 14 Oct, 2021 @ 5:51pm 
Ricebug, I couldnt tell you, If my directions are not working for you then I would suggest reading and following the directions given on the USGS site!
Ricebug 14 Oct, 2021 @ 4:48pm 
I left a note on your YT video that covers this same subject. Doesn't look like you go there too often so I'll paste the question here: What is the purpose of drawing the purple box when the entire visible map is rendered? One would think the extents box defines what you want rendered.

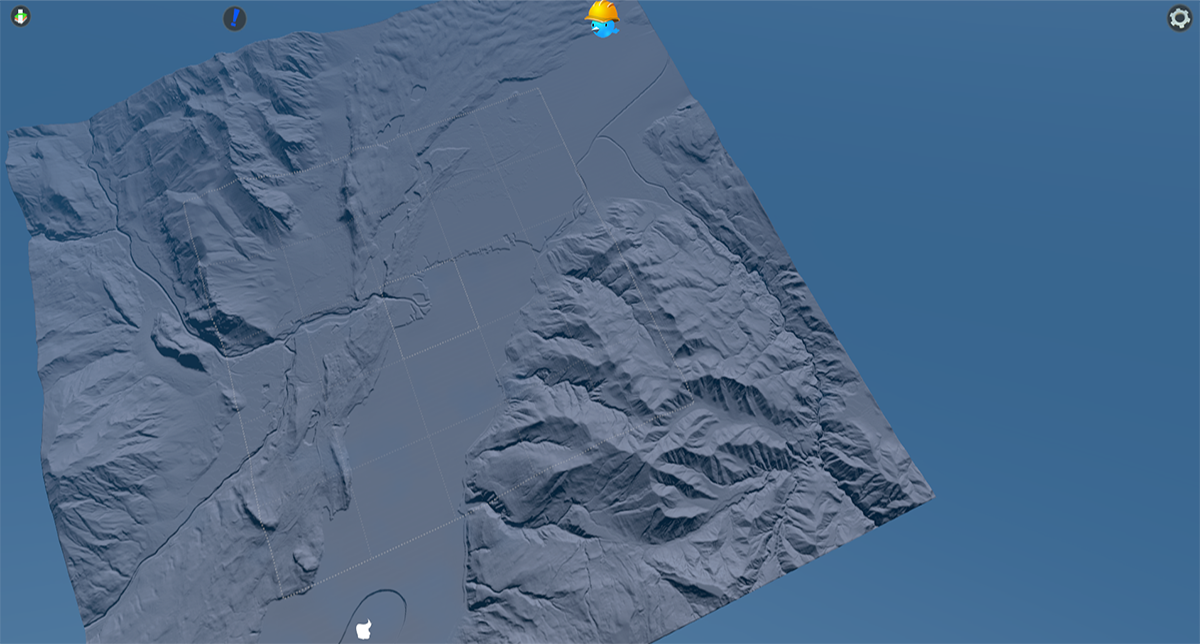
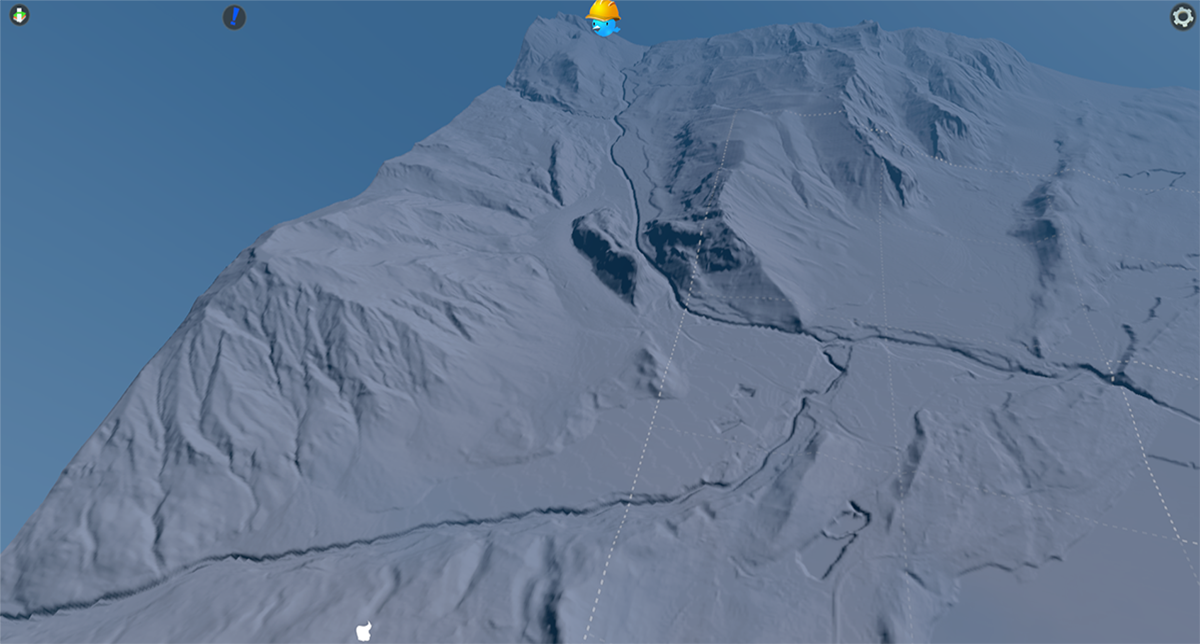
I notice that when you rendered the San Francisco area, you had the same problem: everything rendered that was on the map screen. It should have been just what you selected via the purple rectangle.
VecchioChristo  [author] 20 Jun, 2021 @ 1:10pm